Time to Spring ForwardLLC
CultureIQ runs the Culture Health Index inside your organization and turns anonymous staff responses into a clear picture: what is strong, what is strained, and the two or three places your energy will matter most. It runs on a quarterly rhythm, scores itself, and needs no consultant in the room.
Send your staff a single survey link or QR code. Staff need no accounts, and the survey never collects email addresses.
Twenty-eight short statements and two open questions, about ten minutes. People answer for their own experience, honestly.
When the cycle closes, your report arrives with scores, focus areas ranked, staff voice themes, and a 90 day starter plan.
This is the real report format, filled with sample data so you can judge the deliverable before you buy. The organization below is fictional, and every number on this page is sample data.
The two scores are reported side by side and are never blended together. The Culture Health Score is the average of the six drivers below. The Engagement and Commitment index is the outcome measure, reported on its own.
In this sample, the staff believe in the mission and in each other. Teamwork is the strongest part of the culture. What strains it is capacity and follow through: roles blur when weeks get busy, and good work is not always noticed. Both are workable inside 90 days with rhythm and clarity changes.
| Driver | Sample score |
|---|---|
| Mission & Purpose Alignment | 78 |
| Leadership Trust & Communication | 64 |
| Psychological Safety & Voice | 71 |
| Role Clarity & Workload Sustainability | 52 |
| Collaboration & Team Climate | 82 |
| Recognition, Fairness & Growth | 59 |
Focus first: Role Clarity & Workload Sustainability (52). In this sample, staff know the mission but are less sure what is expected of them week to week, and workloads spike without a shared rule for what comes first. The report's 90 day starter plan begins with one page role outcomes and a written priority rule for urgent weeks.
Focus second: Recognition, Fairness & Growth (59). In this sample, good work is noticed unevenly, and chances to grow feel unevenly shared. The starter plan begins with a simple recognition record and published criteria for new responsibilities.
Collaboration & Team Climate (82) is this sample organization's highest driver. People help across roles and treat each other with respect under pressure. The report names it plainly, because a culture plan that spends the strength while fixing the strain is a bad trade.
The Culture Health Index is a 28 statement survey: 24 statements across the six drivers above, plus the 4 statement Engagement and Commitment index, and two optional open questions. Each driver score is the average of its answered statements, scaled to 0 to 100. No result is reported for any group with fewer than five respondents, and individual answers are never shown to anyone. Validation research on the instrument is in progress.
End of sample report. Harborlight Family Services is fictional, and all data in this report is sample data.
CultureIQ is built for small and midsize mission-driven organizations, roughly 10 to 150 staff: nonprofits, charter and independent schools, social impact organizations, and small agencies. The buyer is usually the executive director, the principal, or the HR lead: someone who can feel the culture questions but has no honest, repeatable way to measure them.
No individual answers are ever visible to anyone. Not to your admin, not to the tool's developer, not to us. The survey does not collect email addresses. No group with fewer than five respondents is ever reported, in any department or any cut, and that floor is enforced in the software, not just written in a policy.
Every subscription: a survey cycle each quarter, an Insights Report each cycle, and a trend view across cycles. Subscriptions bill monthly through PayPal. Cancel with 30 days notice.
Anonymous by designBuilt on the Culture Health IndexRuns itself each quarter
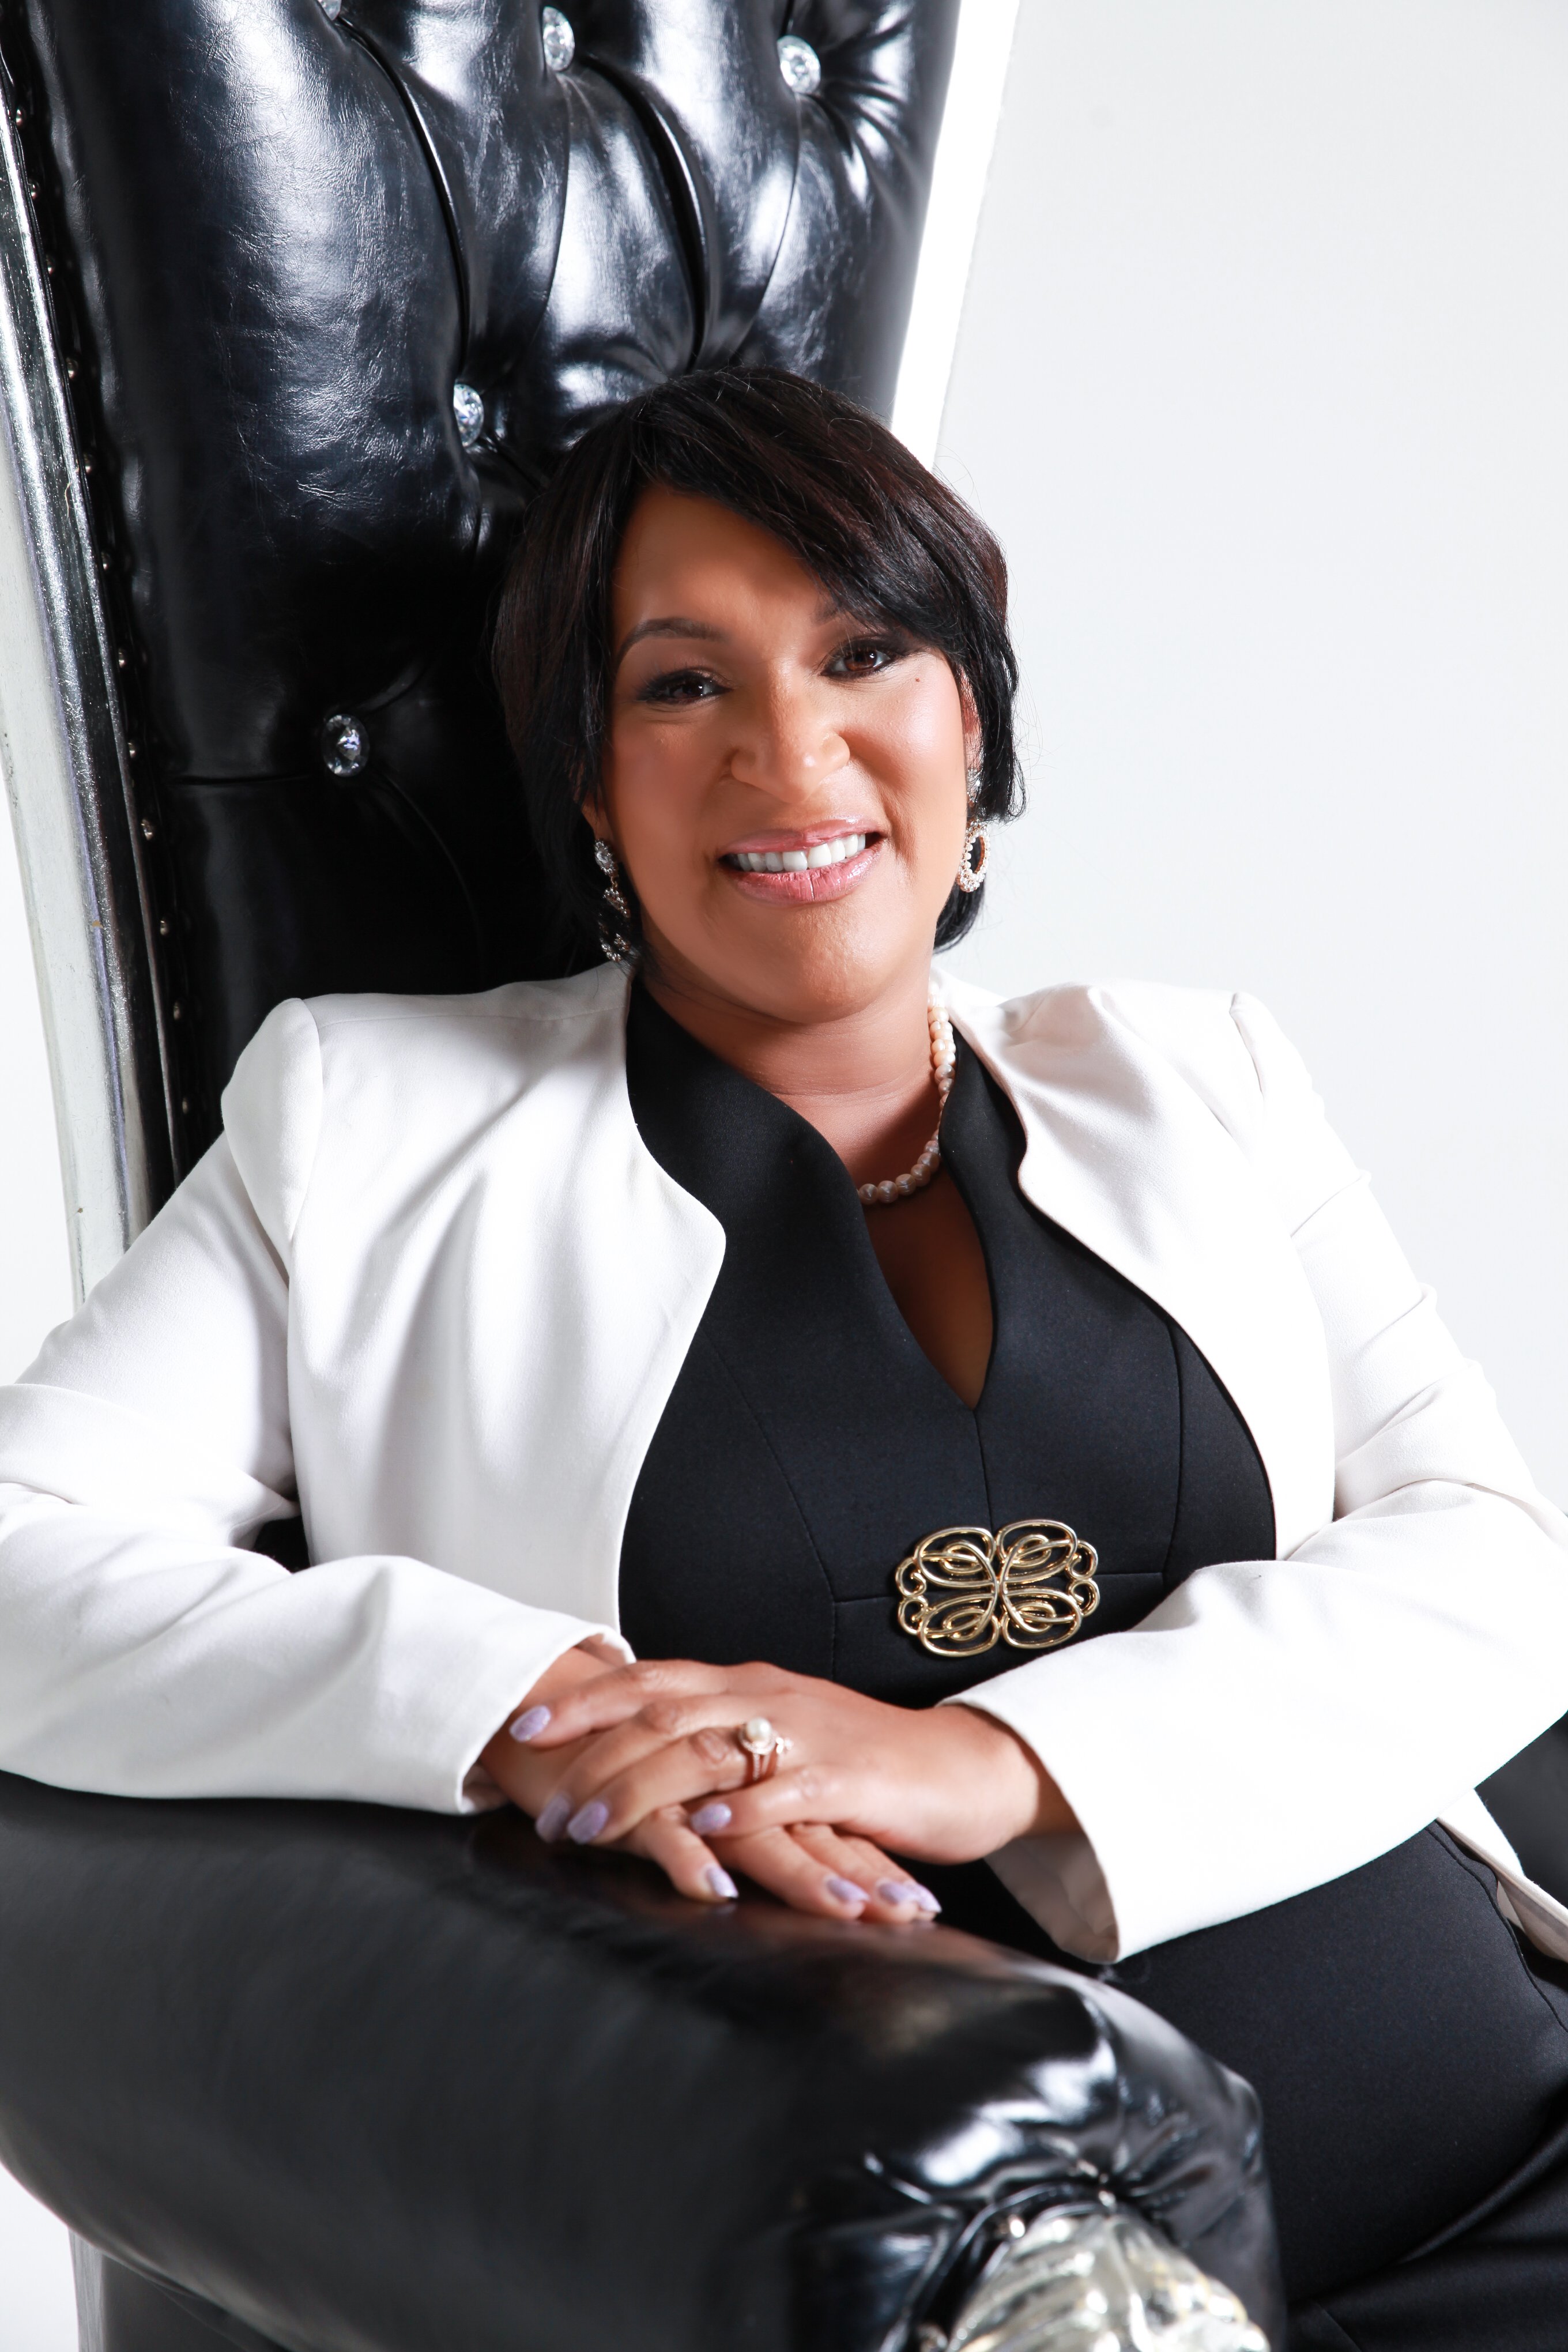
CultureIQ was built by Spring Richardson Perry, founder of Time to Spring Forward, LLC. Spring is working on her PhD in Industrial Organizational Psychology and brings more than 15 years of experience across K-12 education, nonprofits, and government. CultureIQ runs her Culture Health Index, a diagnostic designed for small mission-driven organizations, the leaders who carry their cultures personally and rarely get honest numbers about them. Validation research on the instrument is in progress.
Your organization owns its data. If you cancel, you receive a full export of your CultureIQ data, including your reports and your cycle history. Your data is never held hostage over billing.
The survey never collects email addresses, and there are no staff accounts to sign into. Individual answers are never visible to anyone, including your organization's admin and including Spring. Results are reported only for groups of five or more respondents, and the floor of five is enforced in the software on every cut, including departments.
On a quarterly rhythm: one survey cycle per quarter on subscription plans. You choose the open and close dates inside the quarter, and the trend view carries your scores from cycle to cycle so you can watch the culture move.
You are not paying for a survey. You are paying for the scoreboard that stays up: your workspace, your history, your trend line, and the next measurement already scheduled. The survey runs quarterly; the tool works for you all year.
Cancel with 30 days notice. Your export follows the standing handover policy: full export of your data on cancellation, with no surprise lockouts of the information your board may still need.
It is built from Spring's practice and research: the Culture Health Index, designed for small mission-driven organizations. Validation research is in progress, and every report carries a method note that says plainly what the instrument is. We do not publish benchmarks or norms we do not have.